All-Sky Search
The following scripts reproduce the section of the analysis which searches the entire sky for point sources of gamma rays. All scripts are within the pev-photons/all_sky directory.
All-Sky Scan
The first step is to scan the entire sky for point sources:
python all_sky_scan.py --ncpu *desired_ncpu*
This produces the file {prefix}/all_sky/skymap.npy, which is a healpy map of the test statistic for a point source at each pixel in the field of view.
To convert from test statistics to p-values, it is necessary to know the test statistic distribution for a ensemble of background trials at each declination. For a healpix map of n_side=512, the all-sky scan has 342 unique declination values over the analysis field of view. On the cluster, we evaluated 100,000 trials for each declination in the scan. To do this yourself, on submitter, excecute the following:
python cluster_dec_trials.py
This will store the results in {prefix}/all_sky/dec_trials. A healpy map of pre-trial p-values can be constructed with:
python ts_to_p_value.py
You can skip creating the background trials yourself by adding the --use_original_trials argument.
Finally, to plot the all-sky scan in a South Polar projection (figure 8 in the paper), run:
python plot_p_value.py
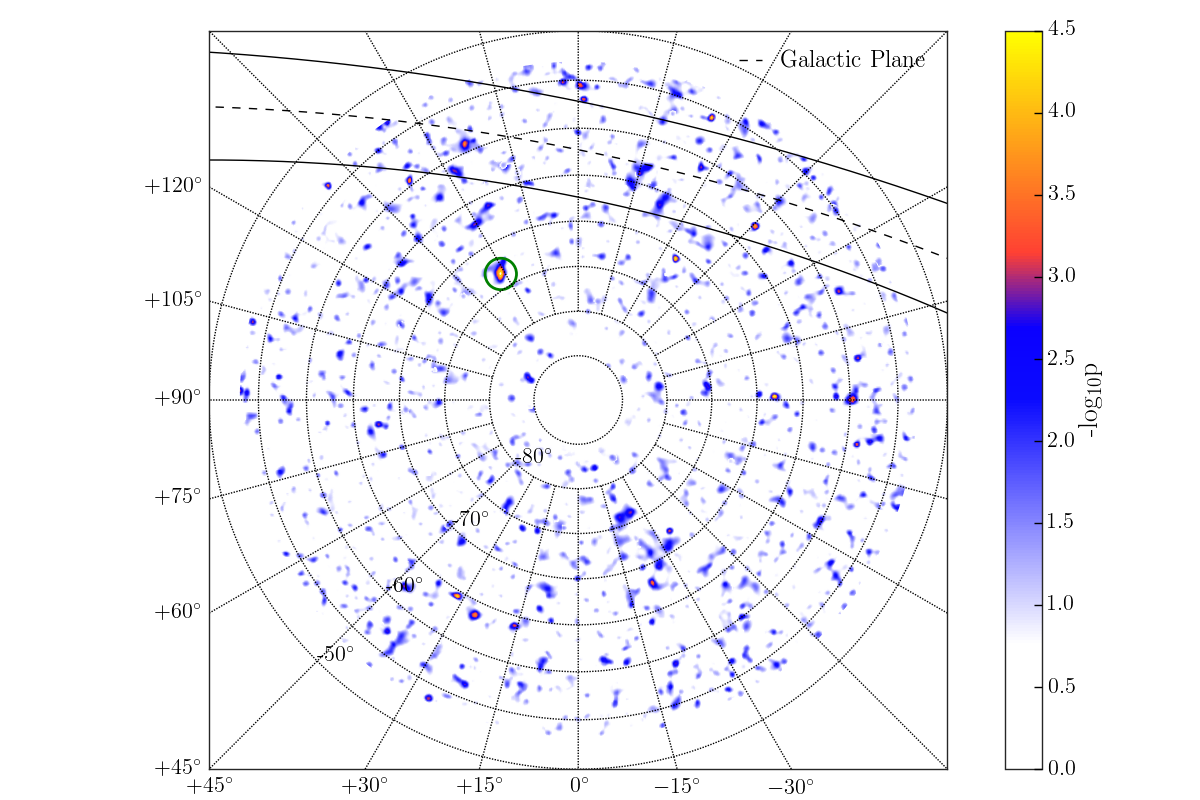
Figure 8: All-sky likelihood scan pre-trial p-values shown projected from the south pole in equatorial units. The right ascension is labeled along the figure axes, with the interior text denoting declination bands. The green circle highlights the hottest spot in the scan. The Galactic plane region (\(<5^{\circ}\) in Galactic latitude) is also shown.
Hotspot
To find the hottest spot in your all-sky scan, run:
python get_hotspot.py
which stores the direction and fit information in {prefix}/all_sky/hotspot.npy. The output should match:
| \(\delta\) [\(^{\circ}\)] | \(\alpha\) [\(^{\circ}\)] | TS | pre-trial p-value | post-trial p-value | \(n_s\) | \(\gamma\) |
|---|---|---|---|---|---|---|
| -73.4 | 148.4 | 20.7 | 0.18 | 0.18 | 67.85 | 2.94 |
Plot the result compared to a distribution of hottest spot test statistics from background all-sky-scan trials using:
python plot_trials.py
This produces the following plot (figure 9 in the paper):
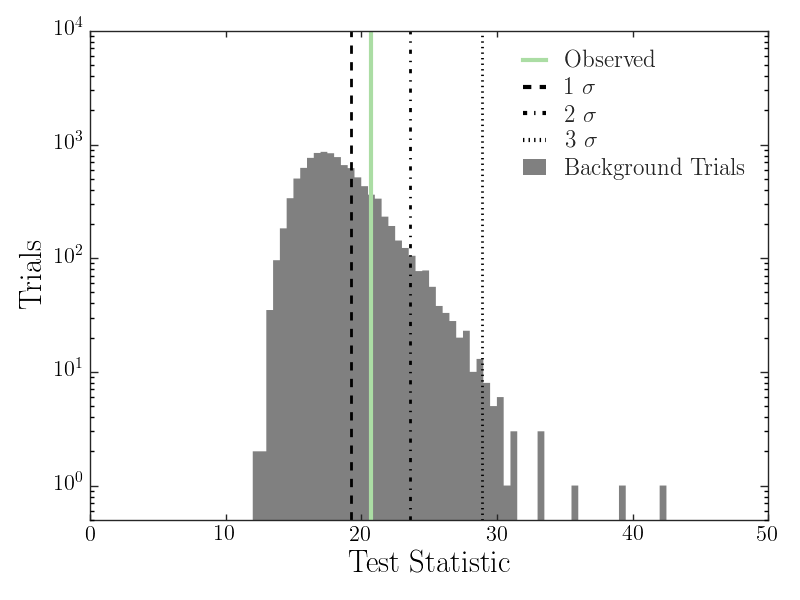
Figure 9: The highest test statistic found in the all-sky scan compared to the ensemble of hottest spot test statistics for background (right-ascension scrambled) trials.
Sensitivity
The sensitivity and discovery potential calculation is quite intensive and for fine steps in declination needs to be run on the cluster.
Fine Steps
On submitter, run:
python cluster_sens.py
This will calculate the sensitivity and discovery potential for steps of 0.1 degrees in declination. Plot the results with:
python plot_sens.py
This produces the left plot of figure 7 in the paper.
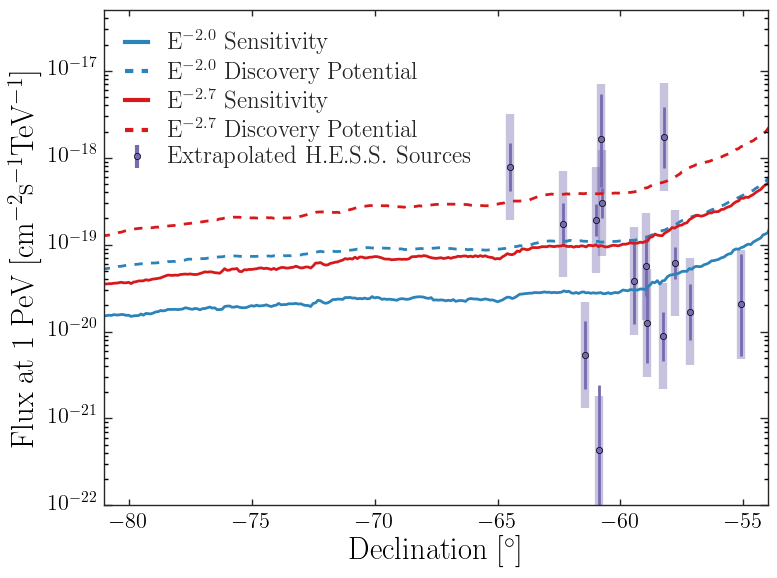
Figure 7 (left): Sensitivity and discovery potential to \(E^{-2.0}\) (solid) and \(E^{-2.7}\) (dashed) sources at 1 PeV are shown in blue and red, respectively. In purple are the extrapolations up to 1 PeV of H.E.S.S. sources in the analysis field of view under the scenario of no break in the best fit energy spectrum but including attenuation. Error bars indicate the statistical uncertainty, while the systematic uncertainty is represented by the shaded boxes.
Coarse Steps
For a quicker test, you can run this to check the declination range every 3 degrees. Run:
python coarse_sens.py --ncpu *desired_ncpu*
This should take around an hour on a cobalt machine with 10 cpus. Then plot these results with:
python plot_sens.py --coarse